
How Production Bottlenecks Drive Up Overtime Costs

Last Updated: November 21, 2026
Quick Summary
Production bottlenecks drive up overtime costs because one slow station sets the pace for the whole line, forcing you to pay extra hours downstream to catch up. In our five-station example, a single aging press needing nine hours instead of six creates $303.00 per shift in bottleneck-driven cost, or $1,515.00 per week. That same constraint generates between about $75,750.00 and $98,500.00 in avoidable labor cost over a 50-week year.
You find a bottleneck by watching where work piles up, not where people look busiest.
Overtime that lands at the same station every week signals a constraint; overtime that moves around suggests scheduling or demand issues.
Adding staff at the constraint changes nothing if the machine itself is the limit.
Match the fix to the cause: rebalance work for labor constraints, add a second shift for machine capacity.
Track overtime hours by station, not just plant-wide, so you can see cost shift from premium pay to idle wages.
Where is your overtime really coming from?
ContinuumPMC helps plants find the constraint behind overtime and fix it for good.
Table of Contents
How to Identify Bottlenecks in Manufacturing Before They Cost You
An Example of a Bottleneck in Production and the Overtime It Creates
Production Bottleneck Causes and Solutions That Cut Overtime
Calculating Manufacturing Overtime Costs Tied to a Constraint
Overtime vs. Alternative Interventions: Weighing the Trade-Offs
Building a Measurement Plan That Holds Improvements in Place
How Production Bottlenecks Turn Into Overtime Costs
A production bottleneck is any step in your process that limits total output, and its most expensive side effect is often overtime. When one station runs behind, the whole line runs behind.
Most overtime in a plant is not a staffing problem. It is a symptom of a constraint that nobody has named yet.
That distinction matters. If you hire more people to cover a machine that cannot keep up, your overtime bill grows while throughput stays flat. The constraint does not care how many hands you add.
How to Identify Bottlenecks in Manufacturing Before They Cost You
You find a bottleneck by watching where work piles up, not where people look busiest. The constraint is the station with the longest queue, the most waiting work, and the most idle time downstream.
Reading the Signals on the Floor
Walk the line and look for three signals:
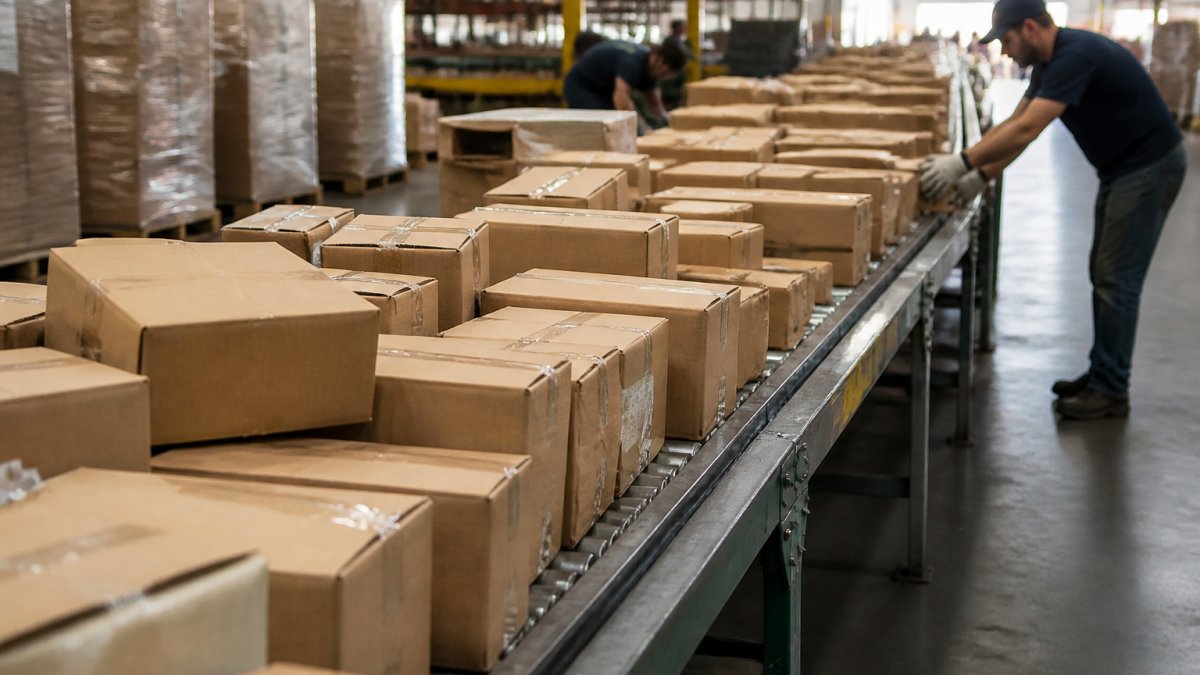
Work-in-process piling up in front of one station
Operators downstream standing idle, waiting for parts
The same station running through breaks while others wait
Those three signals together usually point to a single constraint. Lean Enterprise Institute's guide to value stream mapping shows how to trace the flow and confirm it on paper.
Distinguishing Bottleneck Overtime From Demand Spikes
Not all overtime comes from a constraint. A demand spike lifts every station at once. A bottleneck lifts overtime at one or two stations and leaves the rest idle.
Ask a simple question: did the extra hours land in the same place every week? If yes, you have a constraint. If the overtime moves around, you likely have a scheduling or demand issue instead.
An Example of a Bottleneck in Production and the Overtime It Creates
Picture a plant that runs a five-station line. Four stations finish their work in six hours. The fifth, a single aging press, needs nine.

The press sets the pace for the whole line. To hit the day's target, the plant keeps the other four stations staffed for three extra hours. Those workers are not adding output.
A common mistake is to add staff at the constraint. If the press is the limit, more hands around it change nothing.
Putting Numbers on the Example
Assume the four downstream operators each earn a base rate of $22.00 per hour. The press operator earns $26.00 per hour. The plant runs one eight-hour shift, five days a week, and the press needs three extra hours per shift to clear the day's work.
Downstream idle wages: 4 operators × 3 hours × $22.00 = $264.00 per shift
Press overtime premium: 3 hours × $26.00 × 0.5 = $39.00 per shift
Total bottleneck-driven cost: $303.00 per shift, or $1,515.00 per week
That figure excludes payroll taxes and benefits. A common planning burden of 20% to 30% on top of wages pushes the weekly cost to roughly $1,818.00 to $1,970.00.
Is It Really the Bottleneck? A Short Diagnostic
Before you approve capacity spending, confirm the overtime is constraint-driven and not a demand spike or a scheduling error. Work through these questions in order:
Does the overtime land at the same station every week? If yes, you likely have a constraint. If it moves around, suspect scheduling or demand.
Is work-in-process piling up in front of that station while downstream stations sit idle? A yes points to a capacity limit at that step.
Does the station run through breaks and lunch while others wait? That is a strong constraint signal.
Did the overtime appear suddenly across every station at once? That pattern usually means a demand spike, not a bottleneck.
Did the overtime start after a schedule change, a new product mix, or a staffing cut? If so, fix the schedule or staffing before you spend on capacity.
Watch out: teams often skip step five and buy capacity to solve what is actually a planning problem, which adds fixed cost without removing the overtime.
Once the diagnostic points to a true constraint, the next step is to quantify the cost precisely so you can compare it against the price of a fix.
Production Bottleneck Causes and Solutions That Cut Overtime
Production bottleneck causes and solutions fall into three groups: labor, machine, and material. Match the fix to the cause before you approve another hour of overtime.
Labor, Machine, and Material Constraints
Labor bottleneck: one station needs a skill only two people have
Machine capacity: a single asset runs near its limit all shift
Material shortage: parts arrive late and stall the line
The U.S. Department of Labor's guidance on overtime pay sets the rules for how those extra hours must be paid, which is why the constraint carries a real cost.
Fixes Ranked by Cost and Speed
Fix | Cost | Speed | Best for |
Rebalance work across stations | Low | Fast | Labor constraints |
Add a second shift at the constraint | Medium | Fast | Machine capacity |
Preventive maintenance and uptime work | Medium | Slow | Machine downtime |
Cross-train operators | Low | Medium | Skill gaps |
Add capacity at the constraint | High | Slow | Long-term limits |
If you want a full step-by-step plan once a bottleneck is confirmed, see our guide on reducing overtime in manufacturing shifts. For a proven method to cut the process variation behind the constraint, read Six Sigma's role in manufacturing.
Calculating Manufacturing Overtime Costs Tied to a Constraint
Manufacturing overtime costs tied to a constraint are the wages you pay for hours that only exist because one station fell behind. You can isolate that number with a short formula that separates the overtime premium from the idle wages the constraint forces on everyone downstream.
Bottleneck overtime cost = (constraint overtime hours × base rate × premium multiplier × burden rate) + (downstream idle hours × base rate × burden rate)
Where:
Premium multiplier is 1.5 for time-and-a-half under the Fair Labor Standards Act, or whatever your policy or union agreement requires.
Burden rate is 1 plus your payroll tax and benefits load, commonly 1.20 to 1.30 in manufacturing.
Downstream idle hours are the hours paid to workers who cannot produce because the constraint has not released work to them.
A Worked Calculation
Use round numbers you can swap for your own. The constraint runs 3 extra hours per shift, 5 days a week. The constraint operator earns $26.00 per hour; four downstream operators earn $22.00 per hour. Burden is 25%.
Constraint overtime premium: 3 hours × $26.00 × 0.5 × 1.25 = $48.75 per shift
Constraint base overtime wages: 3 hours × $26.00 × 1.25 = $97.50 per shift
Downstream idle wages: 4 × 3 hours × $22.00 × 1.25 = $330.00 per shift
Total per shift: $476.25
Total per week (5 shifts): $2,381.25
Total per 50-week year: $119,062.50
That annual figure is the number to compare against the cost of a fix. If a preventive maintenance program or a second shift at the constraint costs less than $119,062.50 per year in incremental expense, the fix pays for itself in labor savings alone, before throughput gains and reduced rework are counted.
Breaking the Cost Down by Constraint Type
Overtime does not land the same way across constraint types. A rough pattern many plants see:
Labor bottleneck (skill gap): overtime concentrates on the few qualified operators, so premium pay is high and burnout risk is real.
Machine bottleneck: overtime spreads across all downstream operators as idle wages, so the cost is broad and steady.
Material shortage: overtime appears in bursts tied to late receipts and often includes expedited freight on top of wages.
Approval or scheduling delay: overtime clusters at shift end as supervisors push work through, and it is the easiest type to eliminate with process change.
Tracking the cost by type tells you which fix to fund first. A plant with steady downstream idle wages should attack machine uptime; a plant with concentrated premium pay should cross-train.
Tracking It Weekly
Set a baseline before you change anything. Log overtime hours by station, the premium paid, idle hours at and downstream of the constraint, throughput, cycle time, work-in-process, and on-time delivery. Review the numbers weekly.
Watch out: plants that track only plant-wide overtime hours miss the shift in cost from premium pay to idle wages, and conclude a fix failed when it actually moved the cost rather than removed it.
Overtime vs. Alternative Interventions: Weighing the Trade-Offs
Overtime is the fastest lever and the most expensive one over time. It buys output tonight but hides the constraint. Alternative fixes cost more up front and take longer, yet they remove the cost instead of repeating it.
Use it to protect on-time delivery while you fix the constraint. Then measure whether the fix holds. For a deeper playbook on cutting overtime before you decide, read reducing overtime in manufacturing plants.
Building a Measurement Plan That Holds Improvements in Place
Improvements slip when nobody measures them. A simple plan keeps the fix in place.
Track overtime hours by station, not just plant-wide
Log idle time and work-in-process at the constraint daily
Review throughput, cycle time, and on-time delivery each week
Confirm the constraint has moved before you close the project
This is where many projects fail. The fix works for a month, then the old habits return. Hands-on support that stays in place until the new way of working holds up under real conditions is a core part of ContinuumPMC's approach.
Talk to an Expert About Your Overtime Problem
Overtime tied to a constraint will keep coming back until the constraint is fixed.
ContinuumPMC helps manufacturing and distribution teams align people, processes, and systems so performance holds after the project ends. Our work is tailored to how your operation actually runs.
A good first step is a complimentary labor and performance assessment to quantify your overtime problem. You can also see how we diagnose capacity and inventory constraints through our supply chain and labor management services.
The challenge is not knowing you have overtime. It is proving where it comes from and fixing it for good.
Frequently Asked Questions
How do production bottlenecks increase overtime costs?
A bottleneck caps the output of the whole line, so work piles up in front of it while downstream stations sit idle. To recover the lost throughput and hit delivery dates, plants extend shifts and add overtime. The overtime is often paid to workers who are waiting on the constraint rather than adding value, so the cost rises while output barely moves.
How do you calculate the overtime cost of a production bottleneck?
Start with the hours of overtime logged on shifts affected by the constraint, multiply by each role's fully loaded hourly rate including payroll taxes and benefits, then add premiums such as shift differentials. Subtract the value of output actually gained during those hours. The gap is the bottleneck overtime cost, and tracking it weekly shows whether fixes are working.
What are the most common causes of manufacturing bottlenecks?
Labor shortages on a specific shift, machine capacity limits, unplanned downtime, and material shortages are the usual culprits. Poor scheduling and unbalanced line design also create constraints that look like capacity problems. Root cause analysis on the constraint itself, not the overtime, is what separates a fix that lasts from one that returns next quarter.
How can manufacturers reduce overtime without lowering production?
Relieve the constraint first: add capacity at the bottleneck station, cross-train workers to cover the shift that struggles most, and use preventive maintenance to cut machine downtime. Then rebalance scheduling so work releases match the constraint's real rate. Many plants find overtime falls once the constraint runs steadily instead of in bursts.

Comments